Now is the time to start with the final and main task. During these first weeks we have been trying out a couple of examples of visualizations, using heights to represent values, and isovists to define viewing areas. During the next weeks you will either use one of the examples explained (heights or isovists), or if you feel like it propose your own form of visualization. You will use this within your design projects, that is, you will use information or a problem that may be interesting to look at from your main design course. Remember anyway that we will not be evaluating your project, but only your contribution to the representation course.
Schedule:
Besides the scheduled lectures we have scheduled tutorial times, they are in the calendar (link on the right column of this blog). If any of you have problems with the dates we can surely find some way around it. I (Pablo) am also at the school most of the days, and you can always pass by my office (C 304, on the 3rd floor) if you have any doubts or need advice.
Review and material:
We have scheduled a final review the 25th of November. Then you will present all the deliverables(specified below), and we will tell you how to improve them for the final delivery date, January 13th, 2012. We have also scheduled a final tutorial day the 9th of December, after our final review to help you out with this.
Deliverables.
A physical model, A3 size in base.
Between 2 and 4 A3s (depending on your project).
Groups:
The work will be carried in the same groups you have formed. If you want to change your team (there were some cases in which these groups were provisional) just drop us a mail (pablo.miranda(AT)arch.kth.se).
We will keep you updated (how to book times for the tutorials, etc) during the coming week.
Lecture Diagrams in Architecture

To follow up on my lecture Diagrams in Architecture I provide you hereby the diagram of the lecture itself. Please review the following books and essays that were referred to in the lecture:
- The Diagrams of Architecture by Mark Garcia, book
- Parametric Diagrammes by Patrik Schumacher, essay
- What is a diagram anyway? by Anthony Viddler, essay
- Move by UNStudio, book
- The Future of Information Modeling and the End of Theory, Less is Limited, More is Different by Cynthia Ottchen, essay
Sander
Isovist using Grasshopper in Rhino
 As I showed some of you last time it is possible to do an (almost) interactive Isovist directly in Rhino using the plugin Grasshopper. This means that you can move around a point and the Isovist will update. Similarly changing the obstacles will also update the Isovist interactively (much like the Java applet which Asmund demonstrated last time). I have put together a small demonstration of this which you can download in the applets section of the blog or here.
 Grasshopper is a free plugin (download) for Rhino that will only run on a PC (that means running bootcamp if you are on a Mac) where at least Service Release 8 for Rhino is installed. A workaround is to download the Rhino trial version which comes with Service Release 9. This version will only let you save 25 times on the Rhino side of things though.
Please note that this is NOT a part of the exercise and also that I WILL be doing a demonstration of how this all works Friday 14/10/2011. Happy Isovisting!
-Anders
Please note that this is NOT a part of the exercise and also that I WILL be doing a demonstration of how this all works Friday 14/10/2011. Happy Isovisting!
-Anders
Excercise 2: Isovists
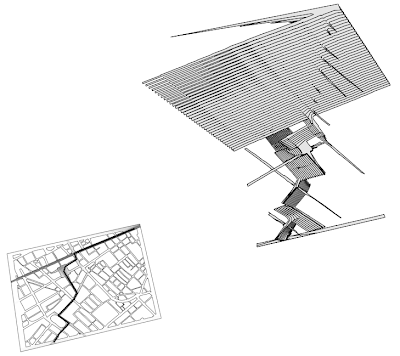
In the second exercise we will generate new spatial descriptions, in the form of diagrams, from urban plans. As an example of this we will focus on a projection technique called isovist or view-polygon, the isovist is usually defined as the area (or volume in 3D) that can be seen from a single point in an environment. It can be geometrically constructed, or it can also be approximated in a physical model with a point-like light source. In the previous exercise we saw how we could use the z-axis to represent and visualise additional information (a magnitude of some sorts), and in this exercise we will use the z axis to show changes over time (moving along a path), or an ordering of shapes according to area.
We have made another applet for you to work with.
The applet takes a DXF as input with the following information:
- Non-intersecting Lines or Polylines (open or closed) on a layer called "obstructions".
- Circles on any layer will be interpreted as view points (optional).
- A single Polyline on a layer called "path" (optional, if present will override the points).
And you can export a DXF with the following data:
- All obstructions as Lines.
- View points as Circles.
- Path as Polyline.
- Isovists as closed Polylines.
Number of Samples: When working with paths you can decide the number of total samples along the path for the calculations.
Vertical Scale: All the isovists are visualised stacked on top of each other and you can set the z distance between each "layer".
Calculate isovists: You need to press this for anything to happen after you import a file, or if you change the number of samples.
Submission:
-Use the A3 Adobe Illustrator template, (downloadable from "Templates" on the blog) for submission.
-Submit your drawing to ak3/A31REA Representation 3/Övning_2
-You should submit before October 21st.
Subscribe to:
Posts (Atom)