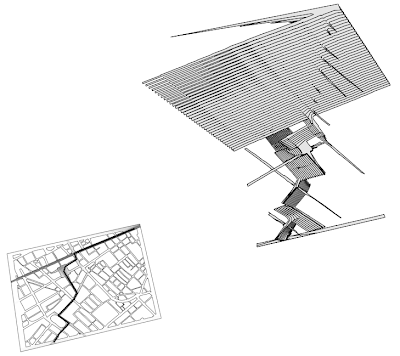
In the second exercise we will generate new spatial descriptions, in the form of diagrams, from urban plans. As an example of this we will focus on a projection technique called isovist or view-polygon, the isovist is usually defined as the area (or volume in 3D) that can be seen from a single point in an environment. It can be geometrically constructed, or it can also be approximated in a physical model with a point-like light source. In the previous exercise we saw how we could use the z-axis to represent and visualise additional information (a magnitude of some sorts), and in this exercise we will use the z axis to show changes over time (moving along a path), or an ordering of shapes according to area.
We have made another applet for you to work with.
The applet takes a DXF as input with the following information:
- Non-intersecting Lines or Polylines (open or closed) on a layer called "obstructions".
- Circles on any layer will be interpreted as view points (optional).
- A single Polyline on a layer called "path" (optional, if present will override the points).
And you can export a DXF with the following data:
- All obstructions as Lines.
- View points as Circles.
- Path as Polyline.
- Isovists as closed Polylines.
Number of Samples: When working with paths you can decide the number of total samples along the path for the calculations.
Vertical Scale: All the isovists are visualised stacked on top of each other and you can set the z distance between each "layer".
Calculate isovists: You need to press this for anything to happen after you import a file, or if you change the number of samples.
Submission:
-Use the A3 Adobe Illustrator template, (downloadable from "Templates" on the blog) for submission.
-Submit your drawing to ak3/A31REA Representation 3/Övning_2
-You should submit before October 21st.